
Understanding React renderings
Main causes of renderings
Today we’re going to get a better understanding of the main rendering concepts within React. For that, we need to understand what are the main causes that cause a component to be rendered.
Let's start this journey!
Parent to children
Whenever the parent component has a new rendering (be it for any reason like change of state, context, called the API, etc ...), the child component will automatically be rendered.
Property
When any component property has a changed value, that component is rendered again.
Hooks
When we call a hook in which it has a data-altering effect (useState, useContext, useReducer, etc...), the component responsible for the call is also rendered again.
Render flow steps
Now that we know the main reasons why React renders a component, let's understand how React does it.
Let's imagine that one of the situations mentioned above happened in a component. Now let's see the step by step that React would do to render the updated component:
- Generate a new version of the component that needs to be rendered (Virtual DOM, saved in memory and is a representation of that DOM that is saved in memory);
- Compare the new version with the previous version already saved on the page;
- If there are changes, React "renders" (transforms the Virtual DOM representation into HTML, this happens only where React identified changes) this new screen version;
Why not check if the current HTML is different from the new one?
Assuming we have the following list structure in a list component:
<ul>
	<li className="1">1</li>
	<li className="2">2</li>
	<li className="3">3</li>
    <!-- ...N -->
	<li className="N">N</li>
</ul>
Imagine that a customer deleted the item from className="532". For React, when it does the new rendering, it will:
- Compare the two HTML trees and you will notice that item 532 is not in the new generated tree (Virtual DOM);
- It will render the entire list with N elements, which can cost a lot of processing on the client side (or on the server, if the solution used occurs on the server side);
- With the reconciliation algorithm, React uses this technique to find elements that have changed during the comparison. With that, it will understand that only that component should be changed. This happens not only for a removal of an element from HTML, but any changes related to it, be it some altered attribute, stylization, addition of new components, etc.
The best tool to analyze renderings in React
If you don't already know the React DevTools browser extension, you need to know it now! This tool gives you "super powers" to analyze your ReactJS applications.
We will address the main features that it provides us and why we should use them.
First of all, know that this extension exists for several browsers, such as Google Chrome, Firefox, Microsoft Edge, etc. So, I will leave the installation link only for Google Chrome (since it is the most used browser), but be aware that searching the internet you can find the installation link for your browser without any problems.
Link to install on Google Chrome
Using React DevTools extension
Once installed on your browser, just your browser's developer console and you will notice that the extension added two new tabs: "Components" and "Profiler".
Now, let's cover each of the tabs added by the extension.
Components tab:
Here it is possible to inspect each element that we have in our applications.
Within each component, we can see:
- Its properties;
- Who is rendering it (parent component) by clicking on a component in the displayed component tree;
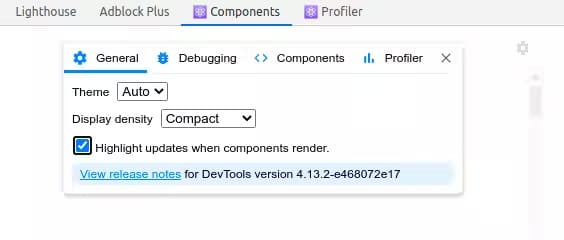
To highlight components that are rendered in the Virtual DOM due to diffing checks, click on the gear icon → General → Enable the "Highlight updates when components render" option.
Profiler tab
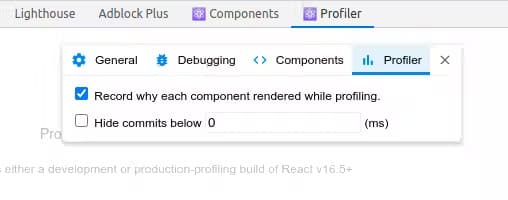
It serves to understand why a component was rendered. To enable this functionality, click on the gear icon → Profiler → Enable the "Record why each component rendered while profiling" option.
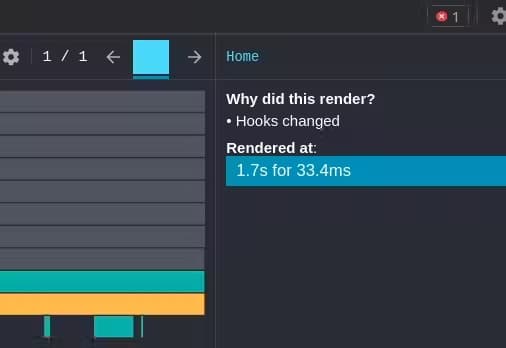
By default, the Profiler is recording the behavior of the components as soon as the page is loaded. To stop recording and see the results, we need to click on the recording icon (ball) at the top left of DevTools.
After stopping recording, we will see a result with the reasons why a component was rendered, see an example:
Conclusion
That's all, folks! Today we learn advanced rendering concepts in React and we also know React DevTools, a super powerful tool that we can use to measure performance and understand what happens behind the scenes in our React applications.
I hope you guys enjoyed this content and we’re leaving next week! Peace out!